LA One Call has used GeoQuery software for over 25 years including a desk-top emergency database, eNotify (an on-line website for updating contact information), Help Desk, monthly billing, and yearly membership report generation
Custom application using REST API to issue enterprise-wide Alertus desktop alert!
CAGWCC Monitored Wells and Database Attributes Viewable from a Google Map overlain with industrial boundary
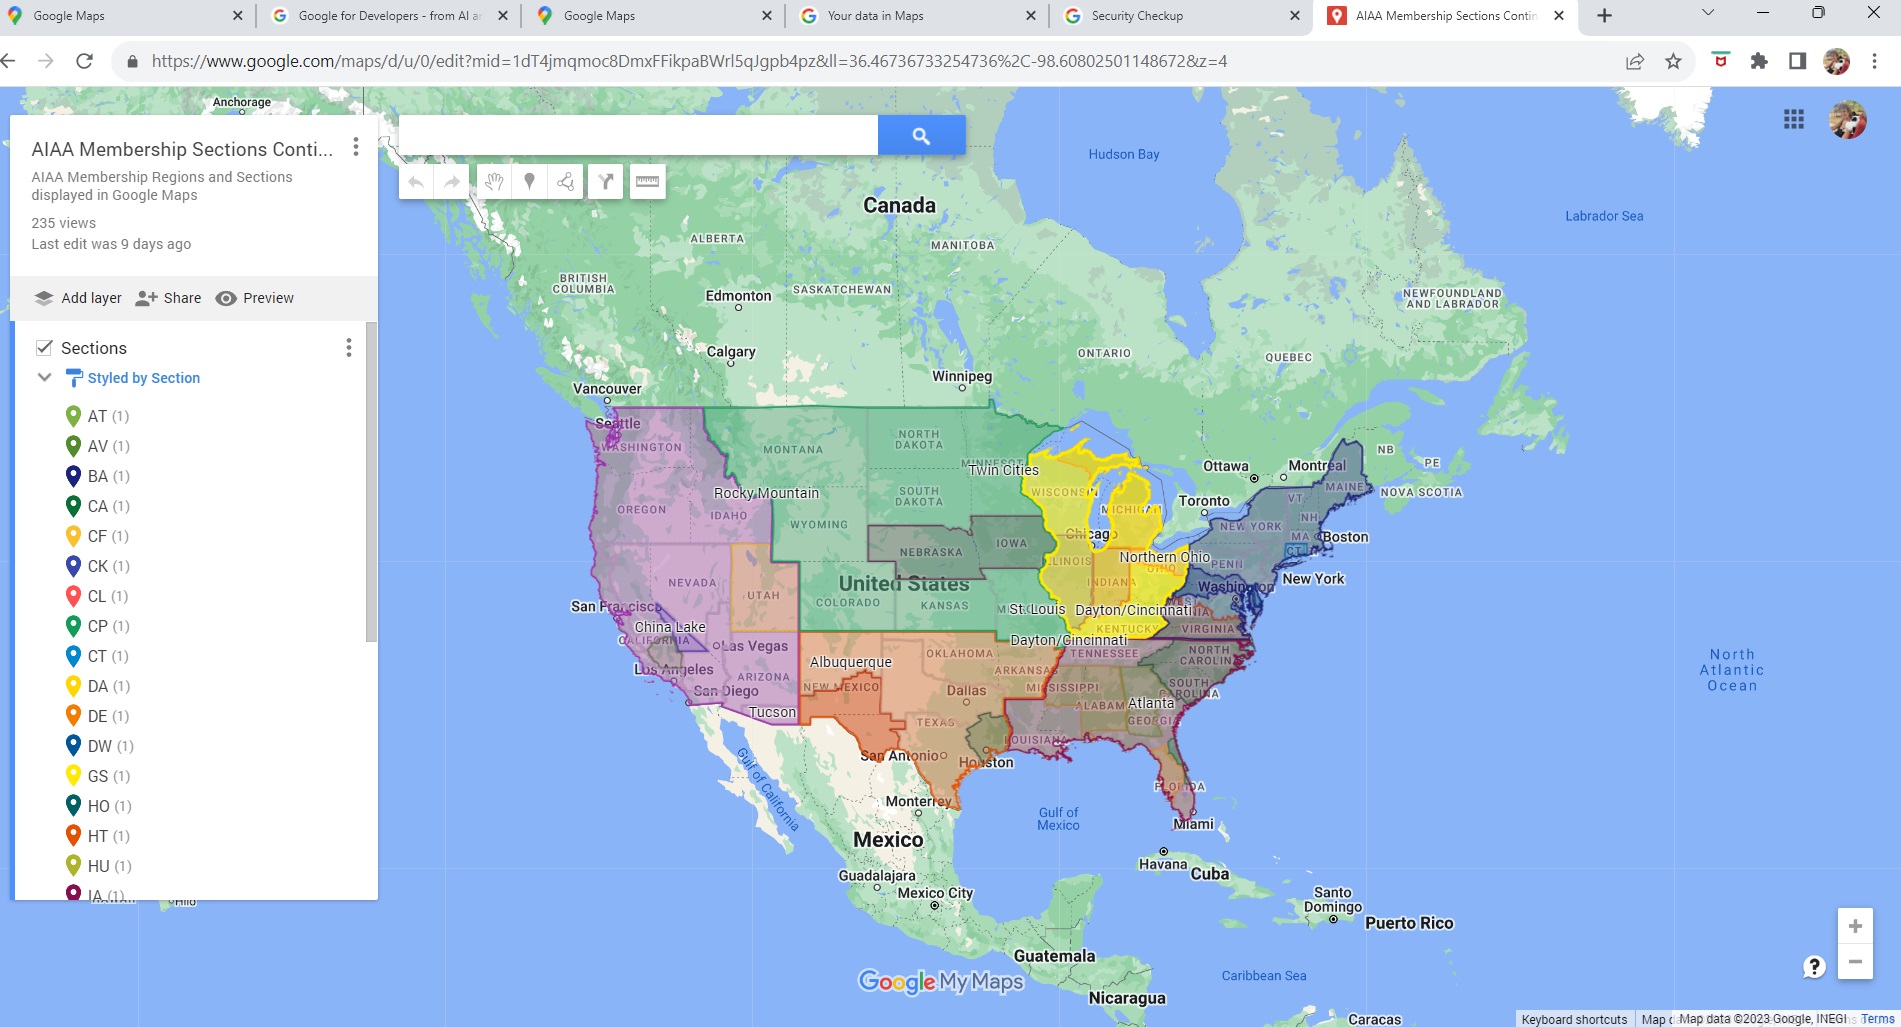
AIAA Membership Sections created by merging counties and portions of counties
Comite River Diversion Taxing District Digitized from 40+ 1:24,000 Scannned USGS Quad Maps with Hand Drawn Boundary
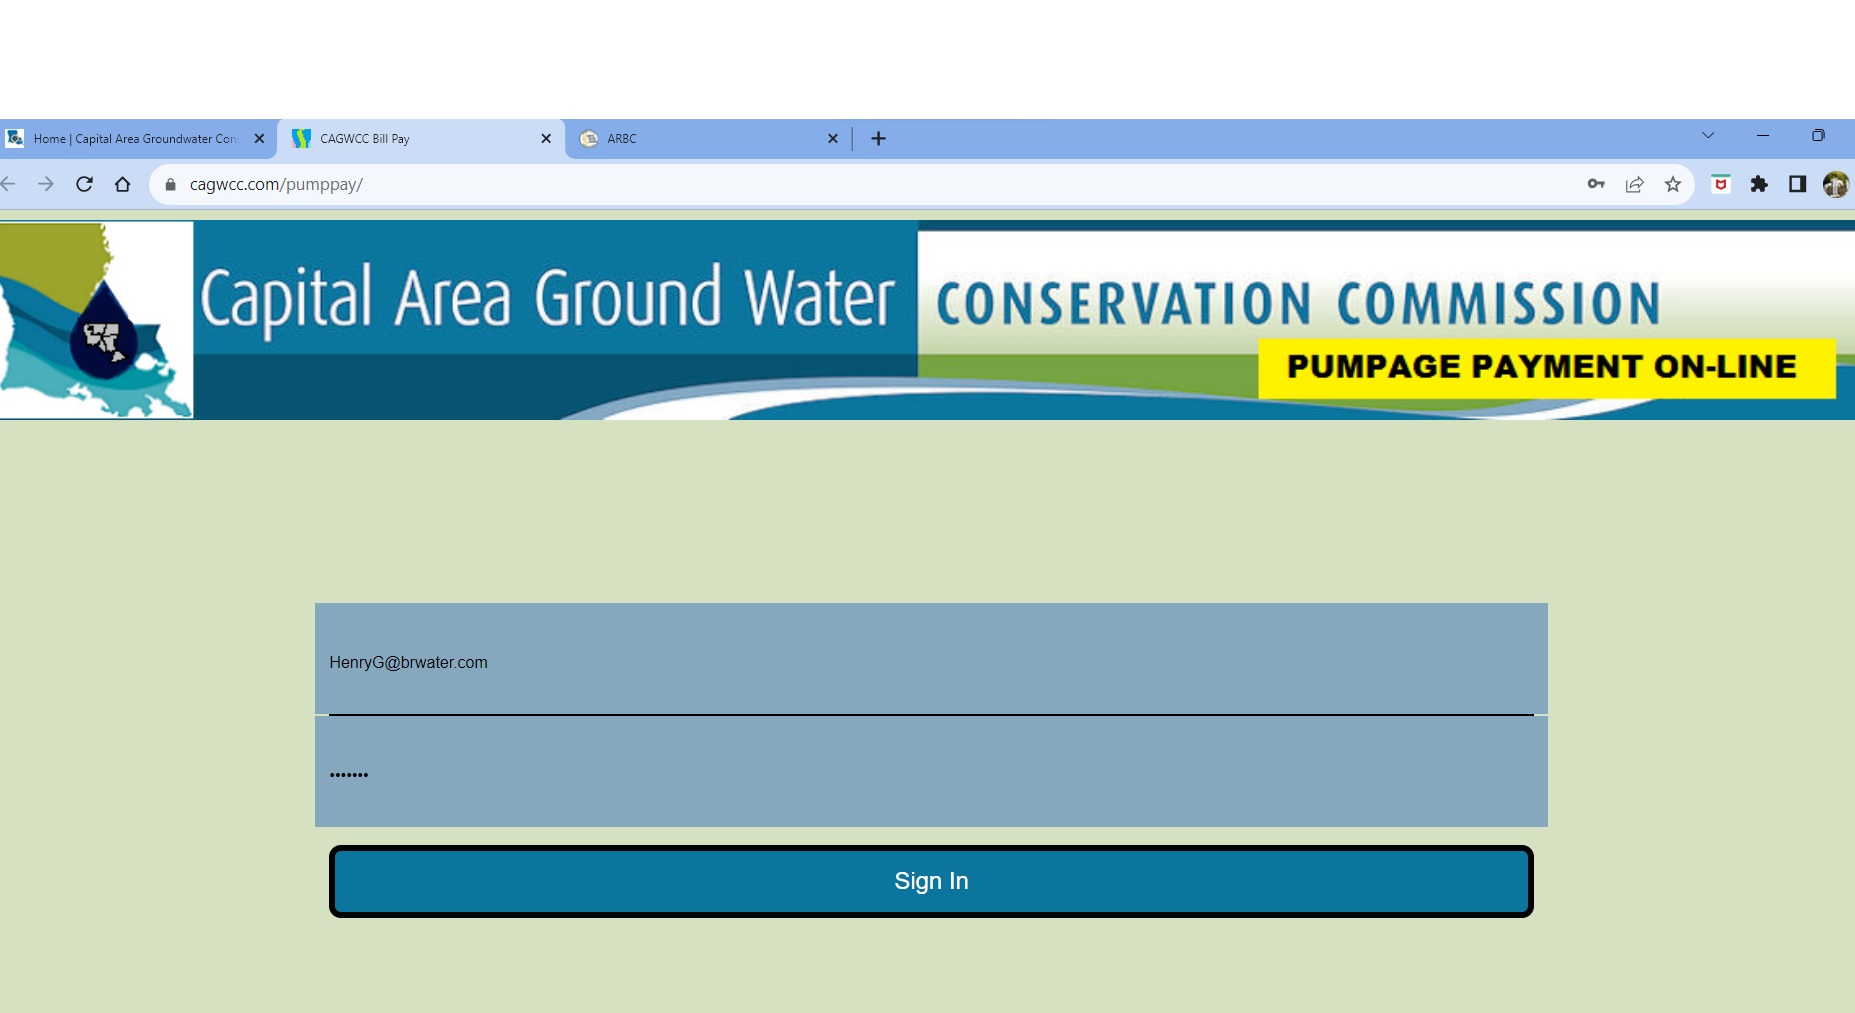
Pump Pay enables Pumpage Payment on-line and has been in use to collect quarterly payments since 2019. Users enter pumpage amounts for each well into a created-on-the-fly invoice and can also submit payment by check or credit card. A status display changes color if total pumpage entered varies largely from previous quarters.
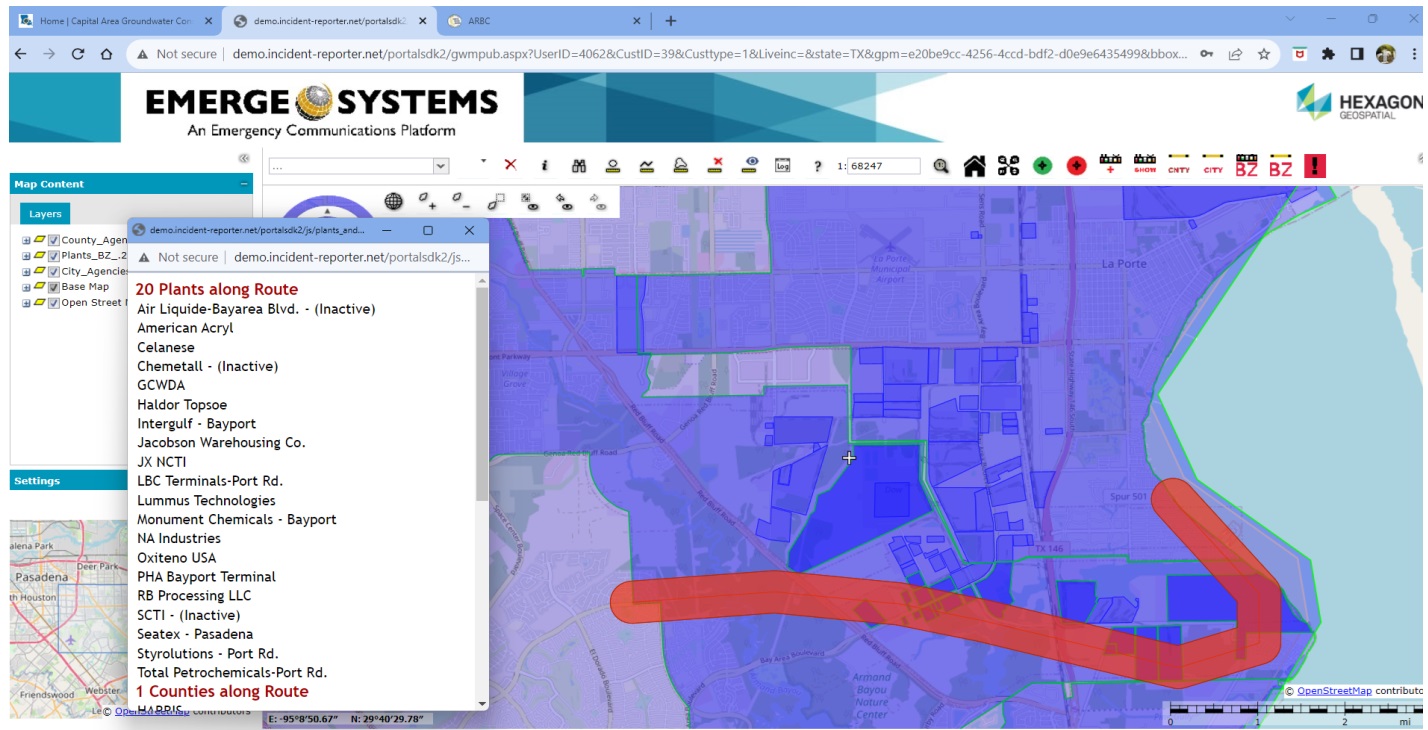
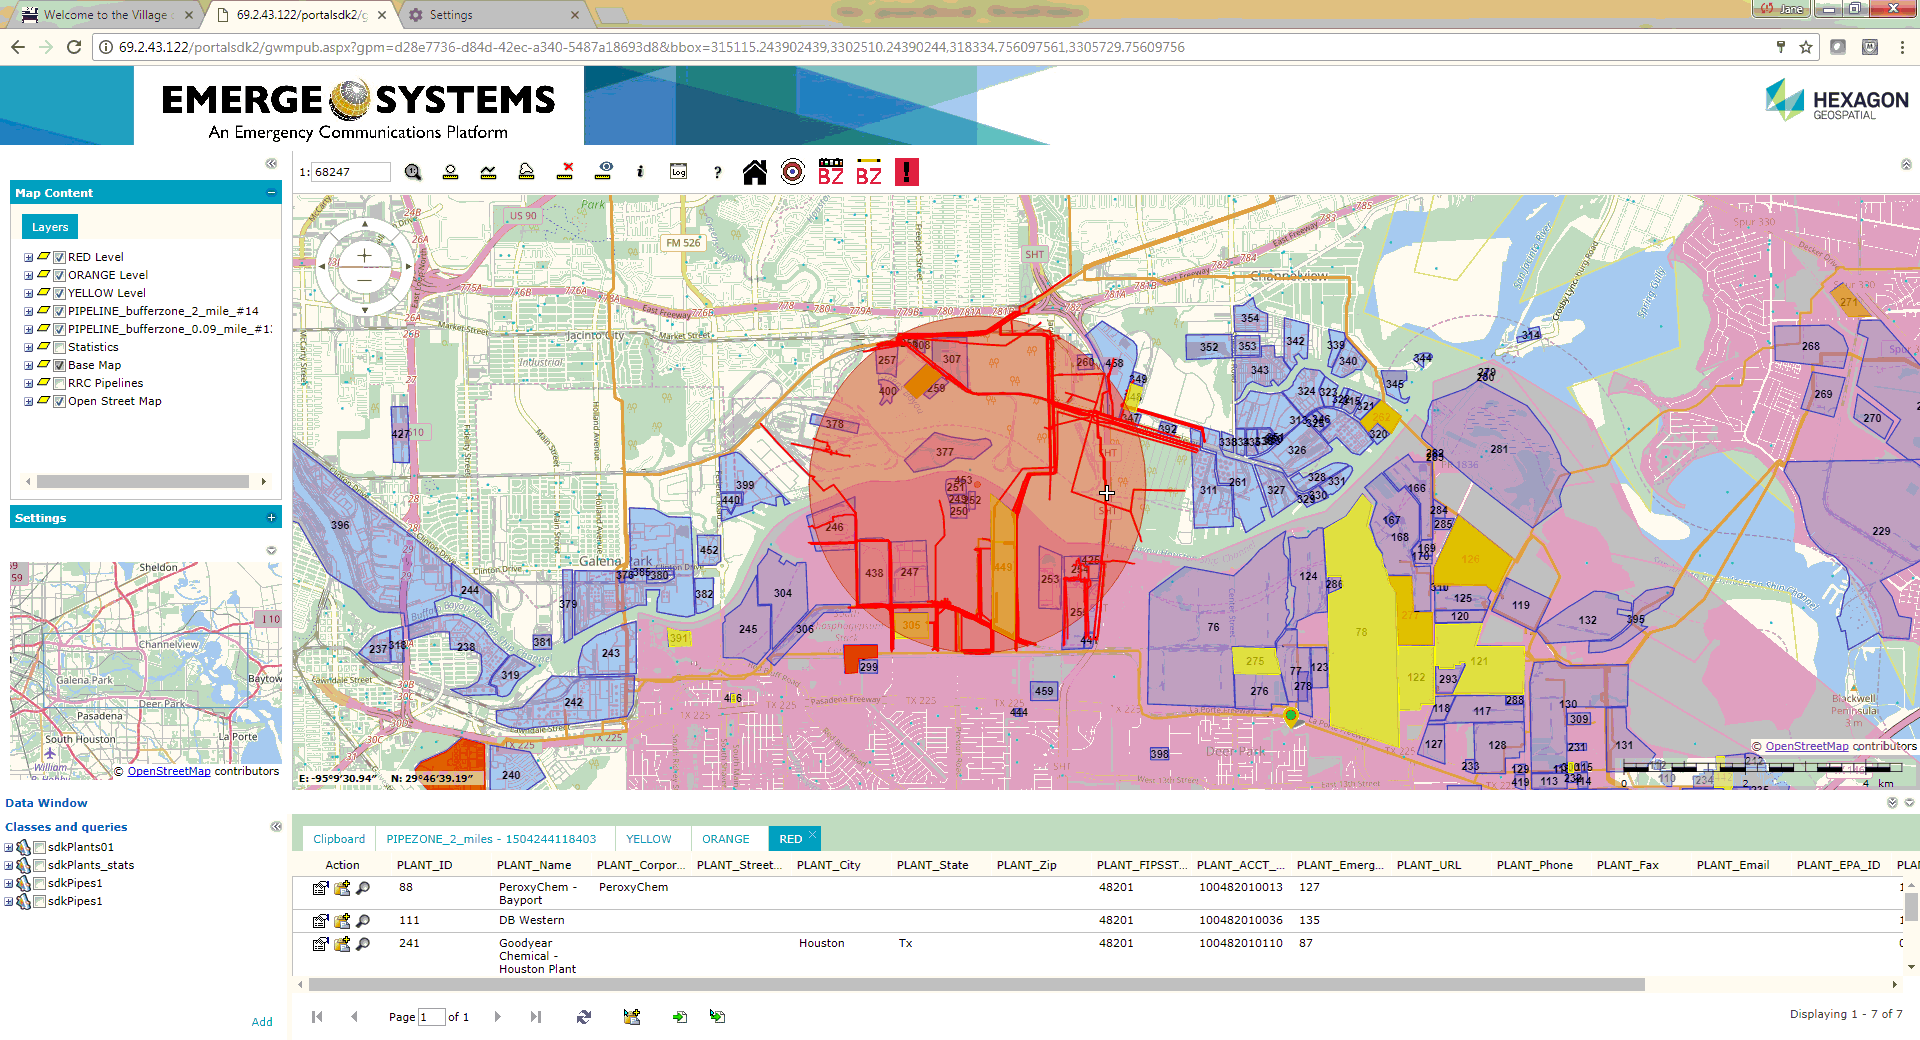
User clicks on points to generate drone buffer zone of specified size to determine plants in path. Drone boundary created using Turf.js advanced geospatial analysis JavaScript functions that speak GeoJSON
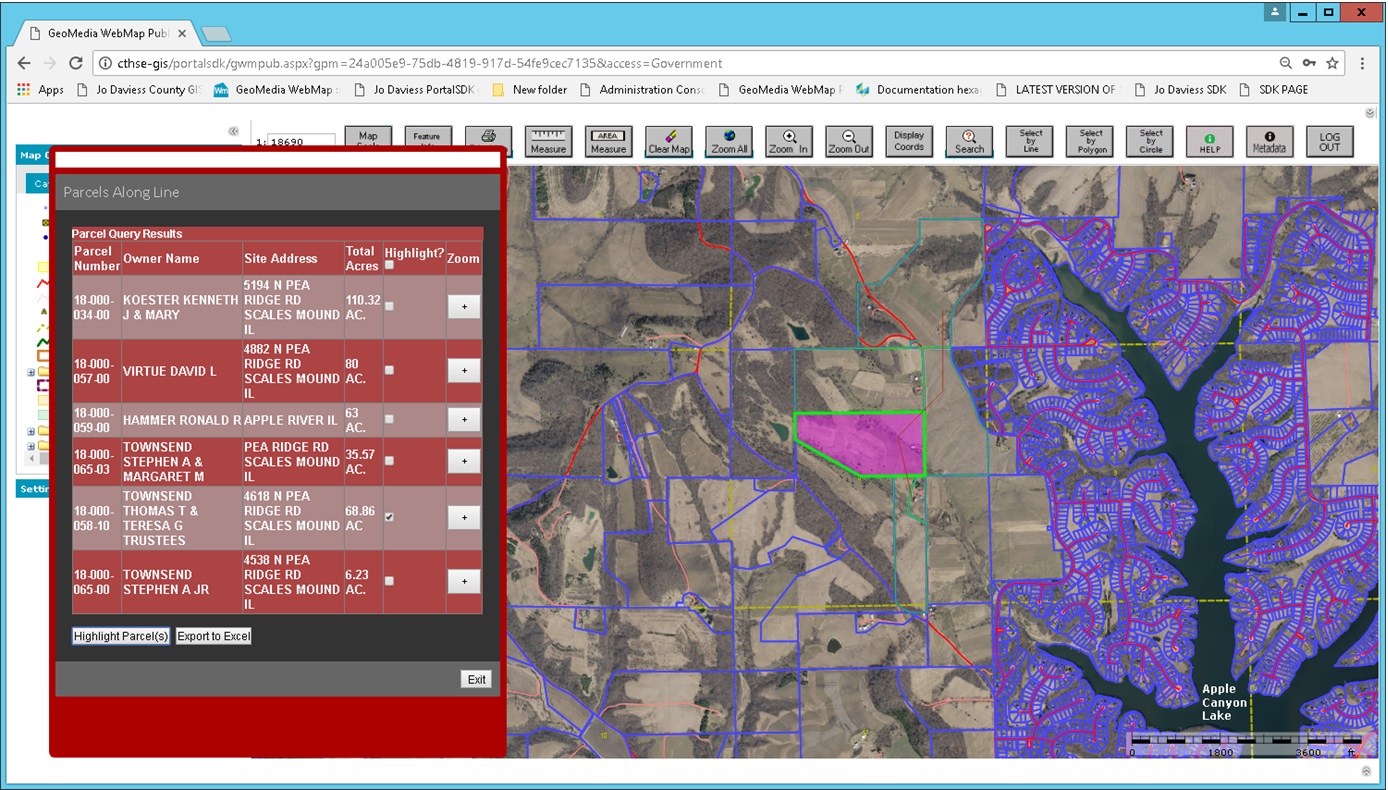
The Parcels Along Line query finds all parcels crossed by a user click entered line and displays them with a bright green border. A table of all parcels intersecting with the line is displayed and user can zoom and / or highlight desired parcels. All attribute information about the parcel can be output to a CSV formatted file suitable for display in Excel. All parcels can simultaneously be selected or deselected by clicking the 'Highlight?' Check box in the table header.
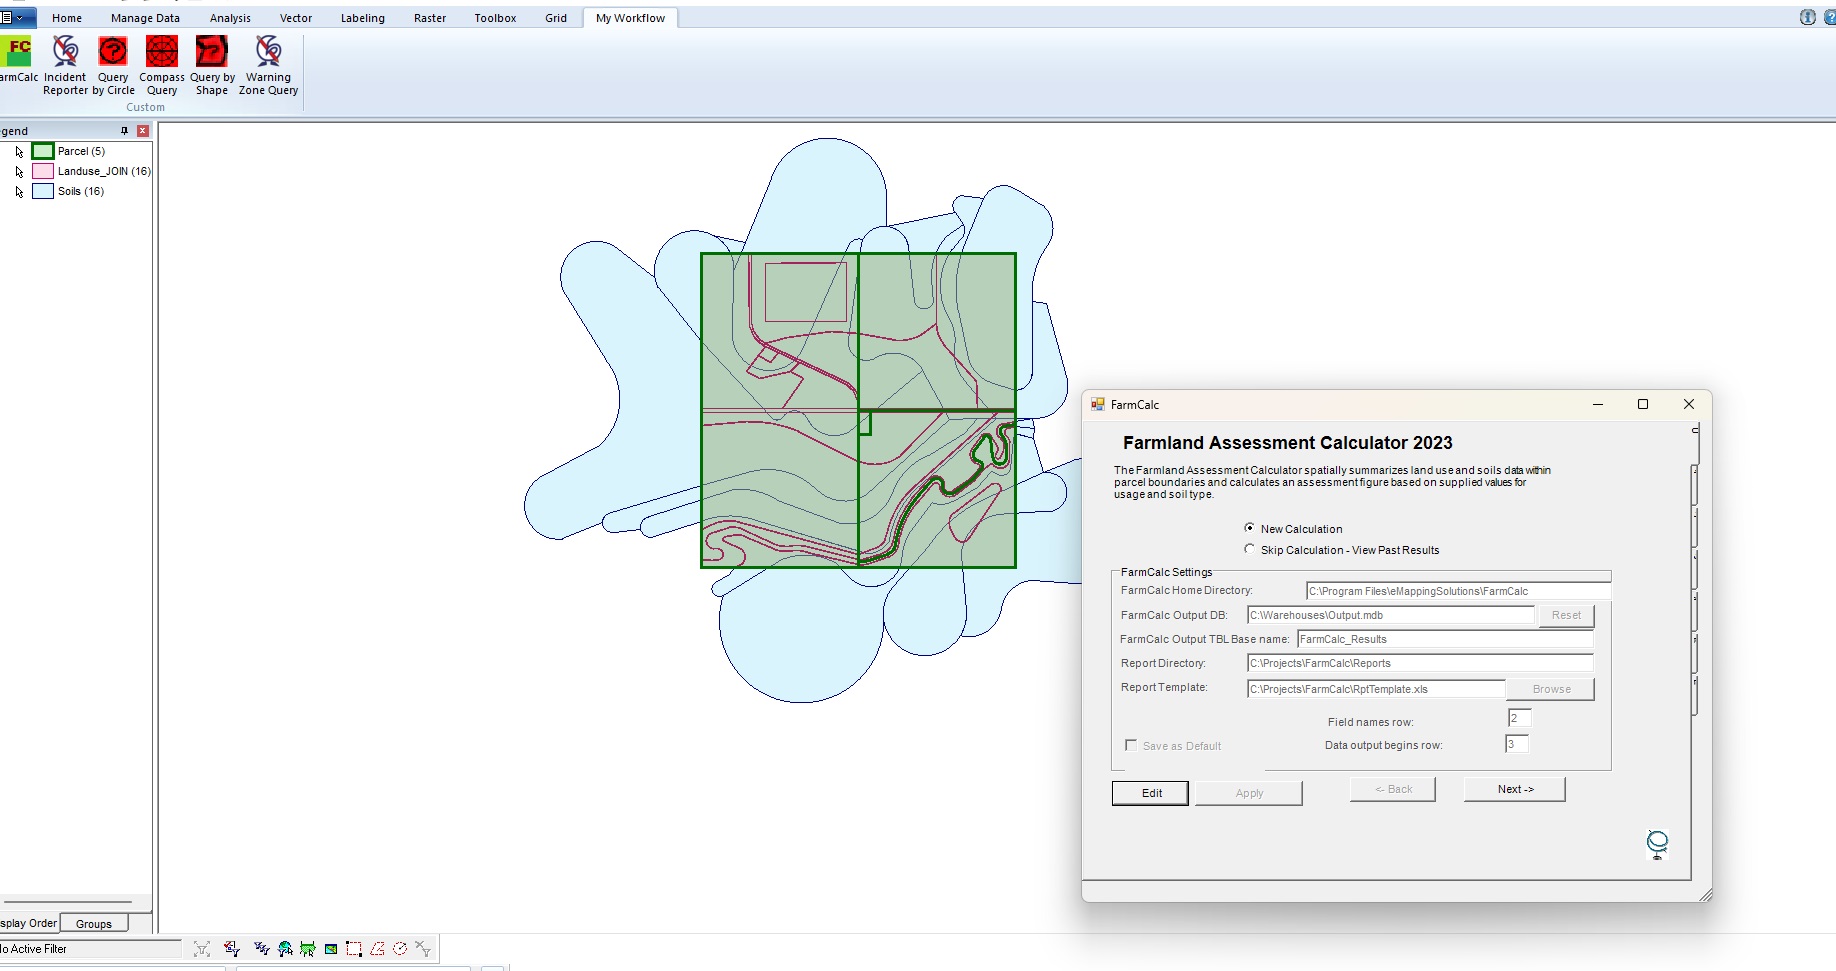
Farm Calc calculates Property Tax based on land use, area, and soil type overlaying all 3 sets of polygons to make this spatial computation and output it to the Assessor for billing
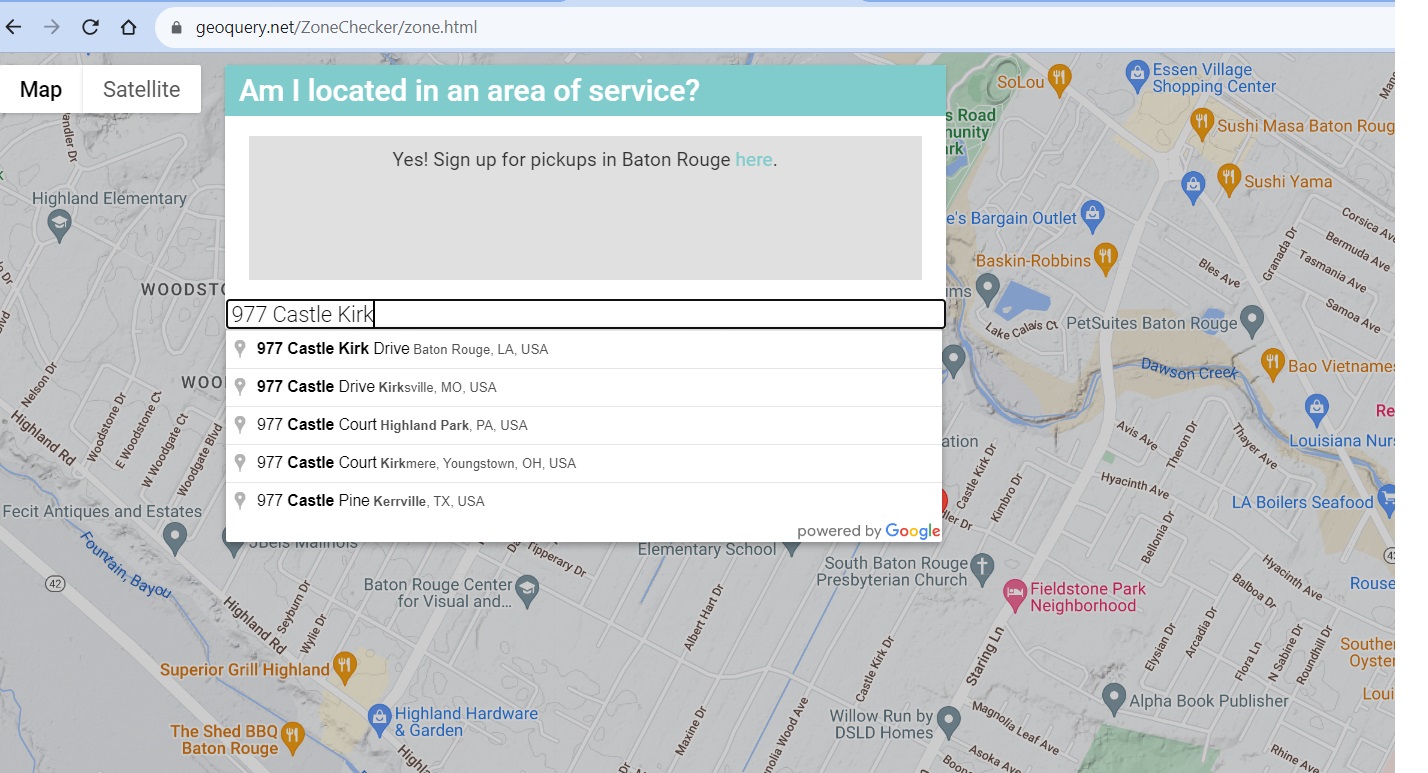
Google Maps API determines if user entered address in the pick-up zone and then redirects to the proper page to sign up for service
Red, Orange, and Yellow Level Incidents in the past 48 hours are updated every 60 seconds on on-line map
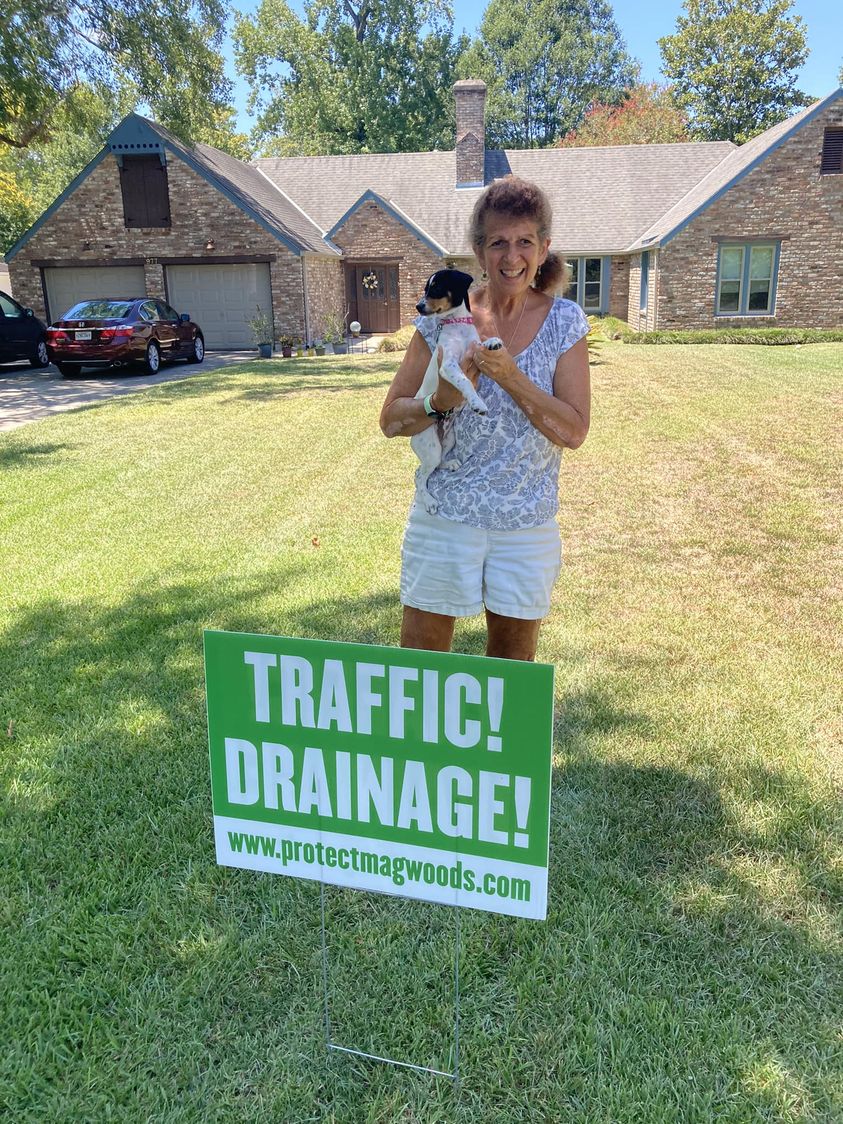
A pro bono public service campaign to protect Magnolia Woods subdivision from drainage and traffic threats from a new development coordinated lawn signs with a webpage created by GeoQuery, Inc. (and mascot dog Magnolia)
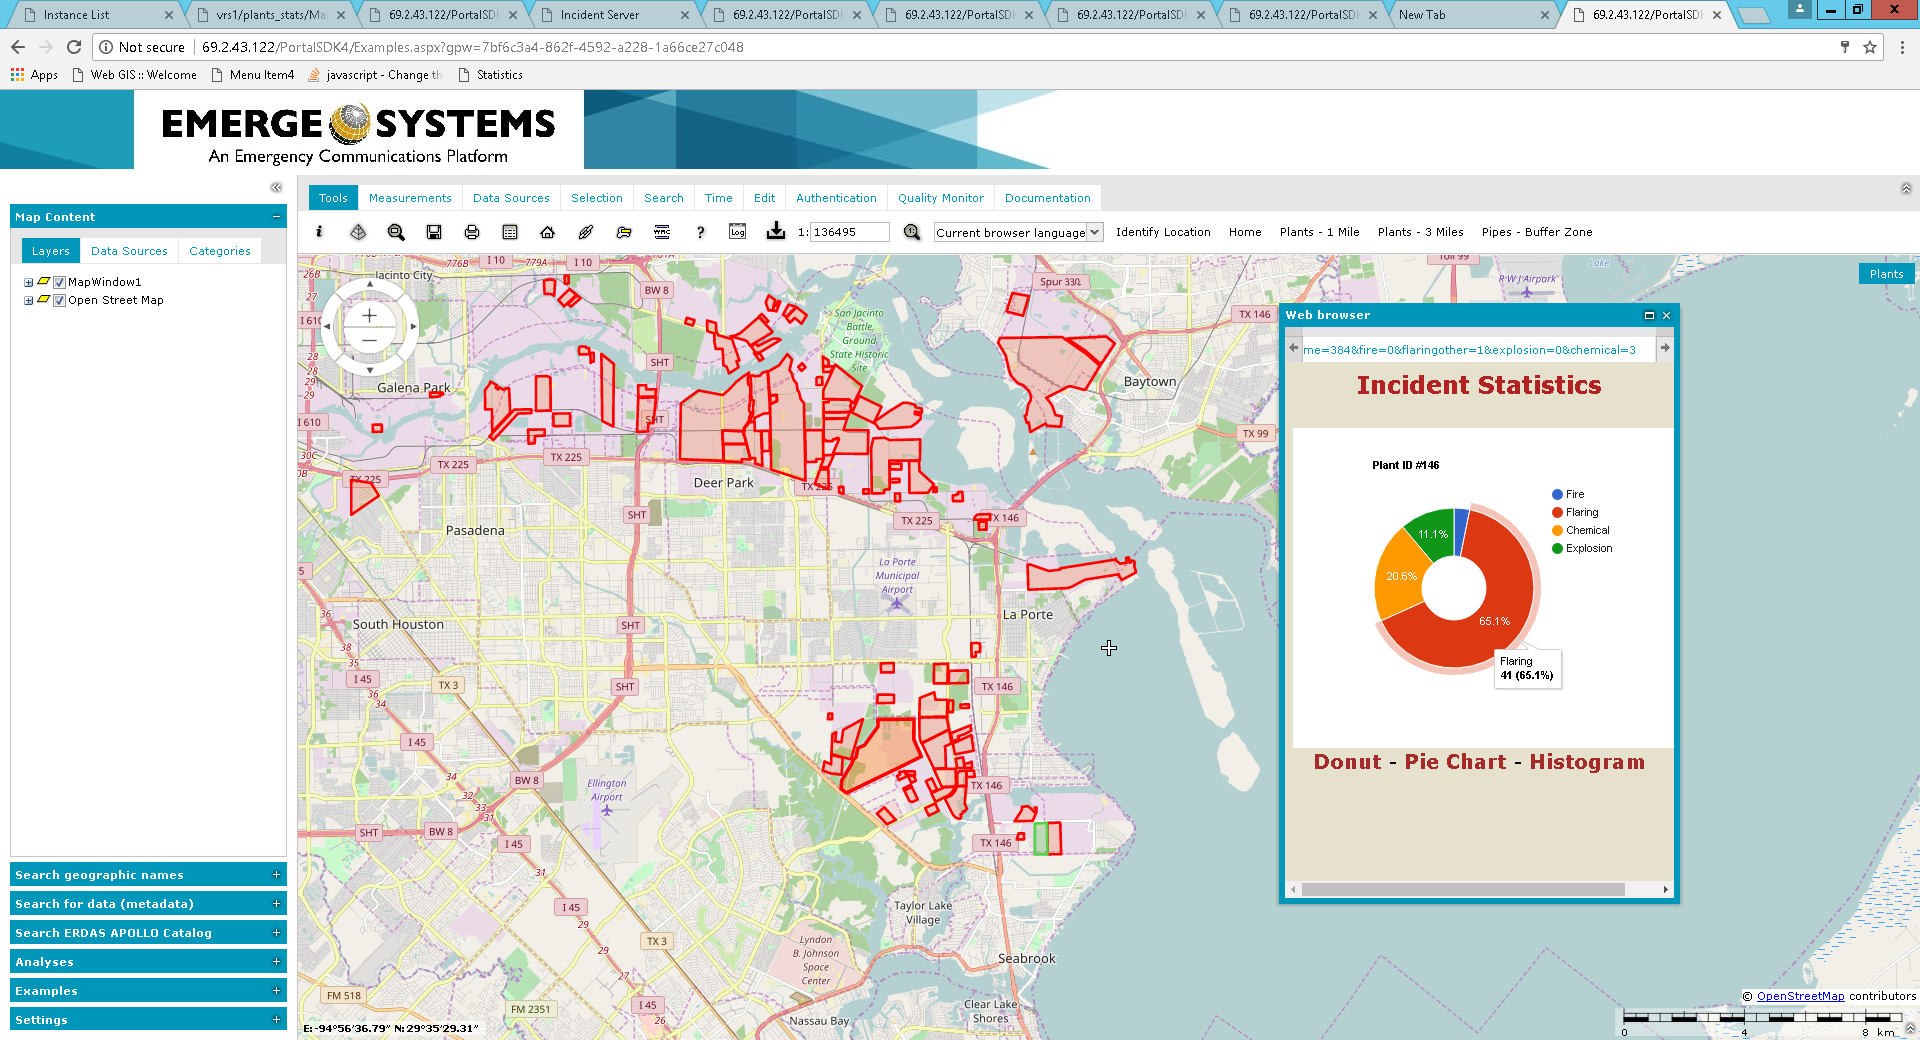
Google Charts used to make the pie, bar, and donut charts to visualize incident statistics
Return